What is Data Visualization? What is its significance?
Data visualization is the practice of using visual representations (graphs, charts, maps, etc.) to convey information about data and processes. Combining math and art can help you tell a story with your data. It’s powerful for communicating messages about topics like global warming to the public or how new technology can help the US military win battles in the future.
What is Data Visualization?
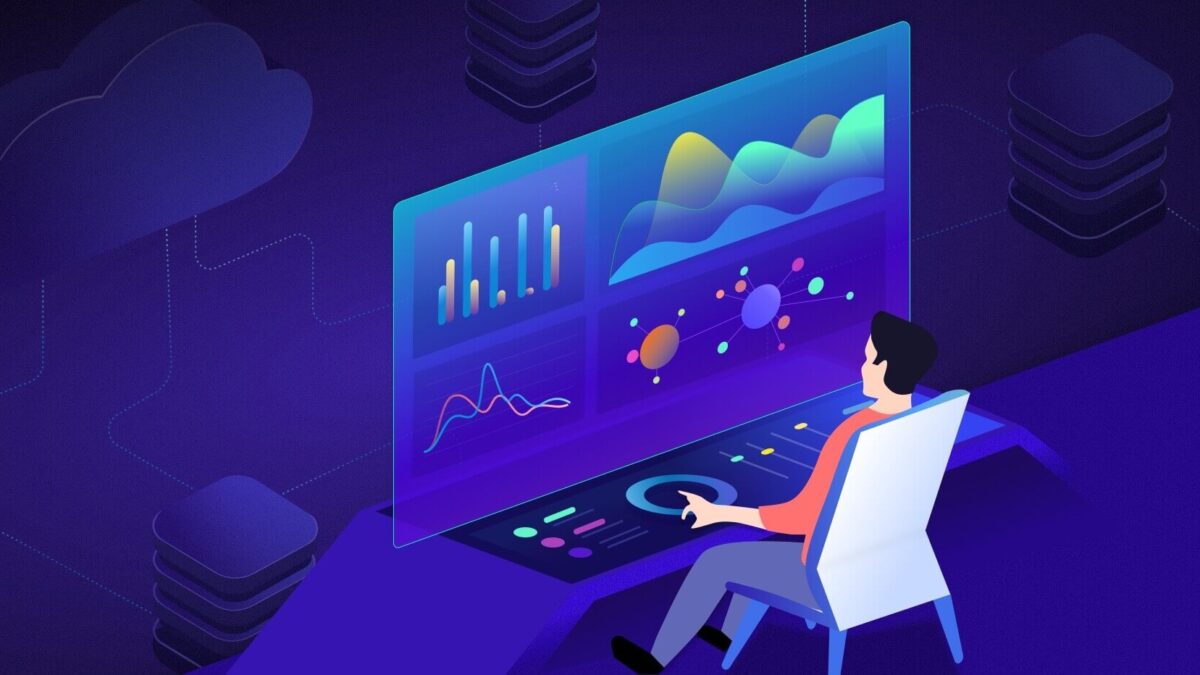
Data visualization connects people with data– and helps them see the big picture. It gives you a simple way to tell stories from your data. It helps you engage with your audience and quickly communicate complex concepts and ideas. And it creates new ways of seeing problems that we didn’t even know existed.
The device data visualization is one of the critical requirements to interact with the data. The data can be diverse in size, structure, and type. Data Visualization plays a significant role in analyzing the data. There are many types of visualization techniques that help in understanding how data & information are stored and how they can be processed effectively to extract meaningful information from them.
Why is data visualization important?
Data visualization provides a quick and effective way to understand, organize, and process data. Data visualization helps to understand data. It helps researchers find patterns in the data very quickly, and every person can tell a story based on the graphical representation or map of that information.
Data visualization can help resolve complex and non-linear problems using extensive visual representations of data. It enables us to discover hidden relationships between variables. A good visualization makes it easy for a user to discover things in a smart home platform that are hard to spot through a simple analysis of the hard copy version of a dataset, whether these things are errors, trends or missing information in the dataset itself.
Other benefits of data visualization:
- the capacity to swiftly assimilate information, develop better insights, and make judgments more quickly;
- an improved comprehension of the subsequent measures that need to be made to enhance the company;
- an enhanced capacity to sustain the attention of the audience by providing them with information that they can comprehend;
- straightforward dissemination of information that allows more opportunities for all parties concerned to exchange perspectives;
- eliminating the need for data scientists since information is now more readily available and easy to comprehend; and
- An improved capacity to immediately act on discoveries and, as a result, achieve achievement with more speed and fewer errors.
What is Big Data?
Big data is a term used to describe large or complex datasets that require new tools and approaches to process them, uncover hidden patterns, associations, trends and other valuable insights like smart SOS that can help inform decisions and support better decision making. Big data can be structured (e.g., relational databases) or unstructured (e.g., text files such as log files).
Examples of big data include text, video and audio, images, streaming media, social media updates, sensor data, scientific experiments, online transactions, and communications. Big Data can change the way of living in a very simpler manner as compared to other things. They can be used for both simple tasks that you do every day and complex tasks that are relevant to our everyday lives, which were not possible before.
Data visualization and big data
The increased popularity of data analytics and big data has resulted in the need for more sophisticated visual representations to help analyze, structure, and display large amounts of data. Some experts believe that the surge in demand for visualizations is driven by the need to understand better the “big picture,” which is argued to be helpful in business decision-making.


